
Vectrex Studio has one debugger, and it follows your game wherever it runs: the 6809 emulator, the ARM emulator, the UVMC2 over a USB cable, and the RP2350 debug cartridge over a debug probe. The breakpoints you set in the editor, the stepping keys and the panels are the same in every place.
Where You Can Debug
| Where | Language | Breakpoints and steps | Call stack | Hover values | Change Value | Game text |
|---|---|---|---|---|---|---|
| Emulator, 6809 | VPy | Yes, in every file | Yes | Yes | Yes | Debug panel |
| Emulator, RP2350 / UVM2 | VPy, C | Yes | Yes | Yes | Yes | — |
| Emulator, gdb | VPy, C | Yes | bt | x, info registers | — | — |
| UVMC2, over USB | VPy, C | Yes | Yes | Yes | Yes, registers included | [rtt] lines |
| RP2350 cartridge, over SWD | VPy, C | Yes | Yes | Yes | Memory only | [rtt] lines |
| PiTrex | VPy, C | No debugger | — | — | — | — |
| WASM simulator (Shift+F5) | C | No debugger | — | — | — | — |
The Basics
Click in the gutter of any line, or press F9, to toggle a breakpoint. Breakpoints are saved across sessions and belong to the open project: one in another project's main.vpy is ignored. A breakpoint on a line with no code of its own (a comment, a def, an else:) stops at the next statement of the same function. When execution stops, the editor opens that file and highlights the line.
| Key | Action |
|---|---|
| F5 | Build and run; while paused, Continue to the next breakpoint |
| F12 | Continue |
| F10 | Step Over: the next statement of this function, over calls. An if whose body is not taken is skipped; the end of loop() goes round to its top |
| F11 | Step Into: the next statement, inside a called function if there is one, in whatever file it lives |
| Shift+F11 | Step Out: run until back in the caller |
| Shift+F5 | While paused, end the debug session |
The same controls are buttons in the Debug Toolbar at the top.
In the Emulator: 6809 Games
- Breakpoints by file, in every module. The IDE always builds with debug symbols and maps each line to ROM addresses through the
.pdb, by file and line:main.vpy:10andutil.vpy:10are different places. Breakpoints also work in single-bank.asmfiles. - Steps follow the program across files, and Step Over skips an
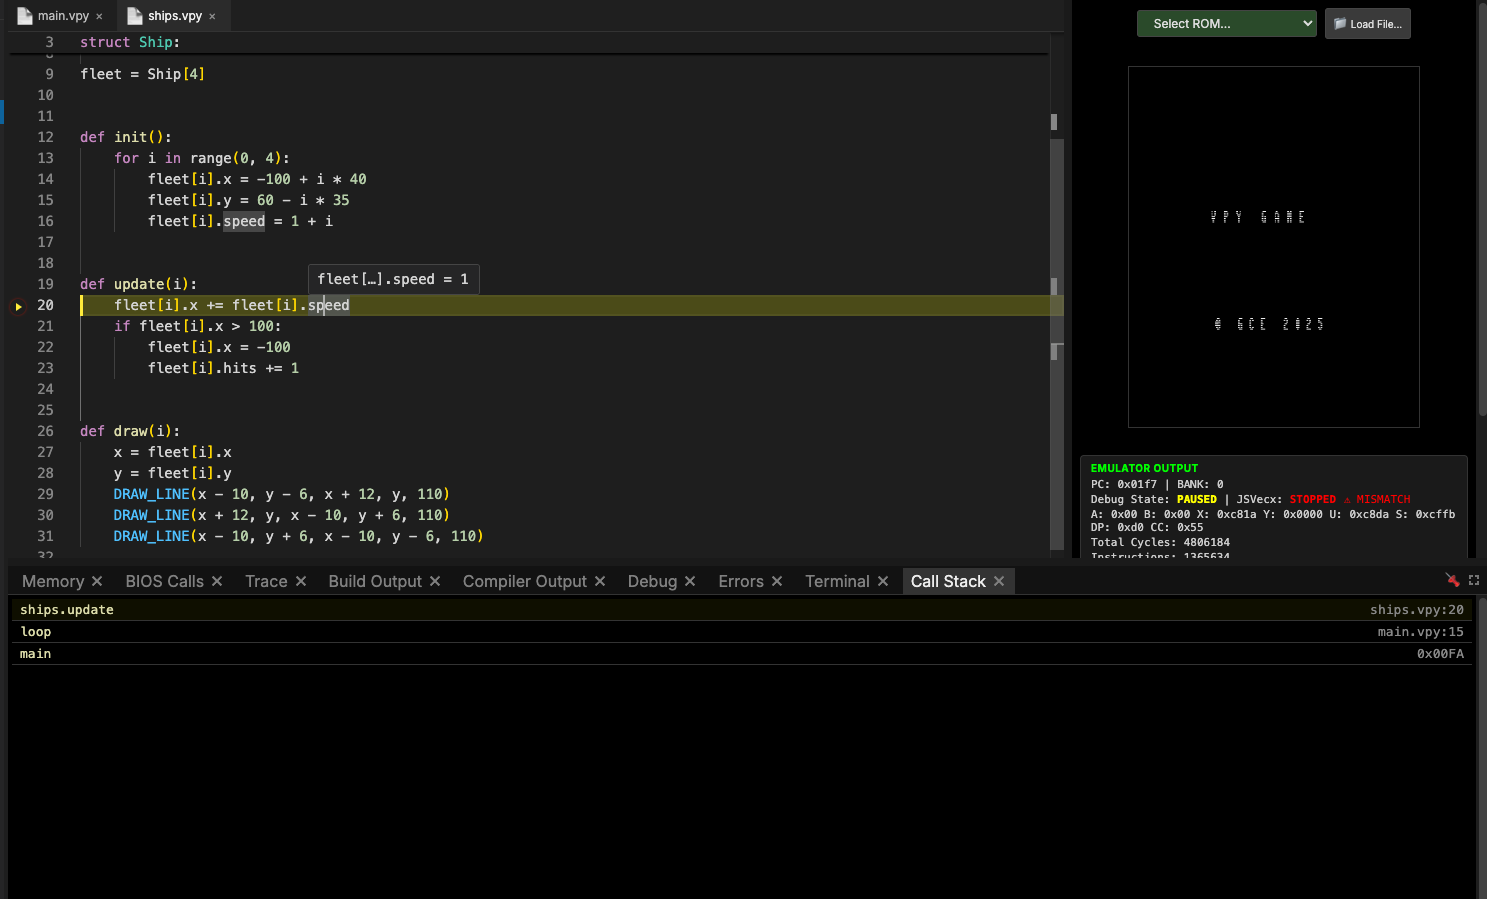
ifbody that is not taken. - Call stack. Rebuilt from the return addresses on the 6809 stack (S), with each user function's file and line. Runtime and BIOS routines appear by name, for example
Moveto_ix←Wait_Recal←loop←main. A call through an indexedJSRshows its callee by address, and in a multibank ROM a caller in a bank that is not mapped is missing. - Change Value writes a variable while paused, including variables the compiler keeps in registers.
- Hover shows every global, array and struct field, and the parameters and locals of the functions on the call stack. One-byte values show unsigned and two-byte ones signed, because the
.pdbdoes not record the declared type. - Memory panel takes its variable names from the
.pdb, next to raw bytes and a grid view.
In the Emulator: ARM Games (RP2350 and UVM2)
ARM builds carry a line table and unwind data in their ELF, and the editor's breakpoints and steps use them exactly as they use the .pdb on the 6809.
- Call stack unwound from the ELF's call-frame information, down through the C runtime and the firmware, with VPy names:
vpy3d_occl_add←ship.draw(ship.vpy:63) ←loop←vpy_run←main←_reset_handler. A pause inside a system call stops at its handler. - Hover depends on how the program was built:
| Build | What hover shows |
|---|---|
VPy, C backend ([uvm2] backend = "c") | Globals with their C types; the parameters and locals of the function you are paused in, or of one gcc inlined there |
| VPy, asm backend | Scalar globals only |
| C projects | See "C projects" below |
A C-backend build is optimised: gcc inlines and reorders, so a line may be skipped, a local may be optimised out here, and main() and loop() themselves appear inlined into the runtime.
Attaching gdb
While the IDE runs, its ARM emulator accepts arm-none-eabi-gdb on localhost port 3333 (the next free port up to 3343 if 3333 is taken; the IDE's log says which). Run the program with F5, then attach with the build's ELF:
arm-none-eabi-gdb build/<name>_uvm2.elf -ex "target remote :3333"Attaching pauses the emulator.
| gdb | Does |
|---|---|
break util.vpy:5, break UTIL_bump | Breakpoint on a line or a function |
continue (Ctrl+C to stop) | Run; the IDE's emulator runs with it |
next, step, finish | Step over, step into, run to the caller |
bt | VPy calls, then the runtime and the firmware below them |
stepi, x/8i $pc, info registers | Instruction level |
x/4wx 0x20010000 | Memory: RAM, flash, PSRAM (not peripherals) |
detach | Remove gdb's breakpoints and let the program run |
Limits: one gdb at a time, core 0 only on dual-core images, and no watchpoints. Breakpoints are the emulator's and are never written into the program. A UVM2 C project is debugged the same way with its own ELF.
On the UVMC2, Over USB
With the UVM2 target, Debug → Debug on Cartridge (RP2350 SWD / UVMC2 USB) uploads the game, starts it on the console and attaches the debugger to it. No debug probe and no extra wiring: the same USB cable you use for Upload to Cartridge. It needs SDK v1.4.0 or later.
You get the full debugger:
- breakpoints, F10 / F11 / Shift+F11, Continue and Pause;
- the call stack and hover values;
- Change Value, including the CPU registers;
- the game's text:
DEBUG_PRINTandvpy_loglines arrive over the same cable and show in the build output as[rtt] ....
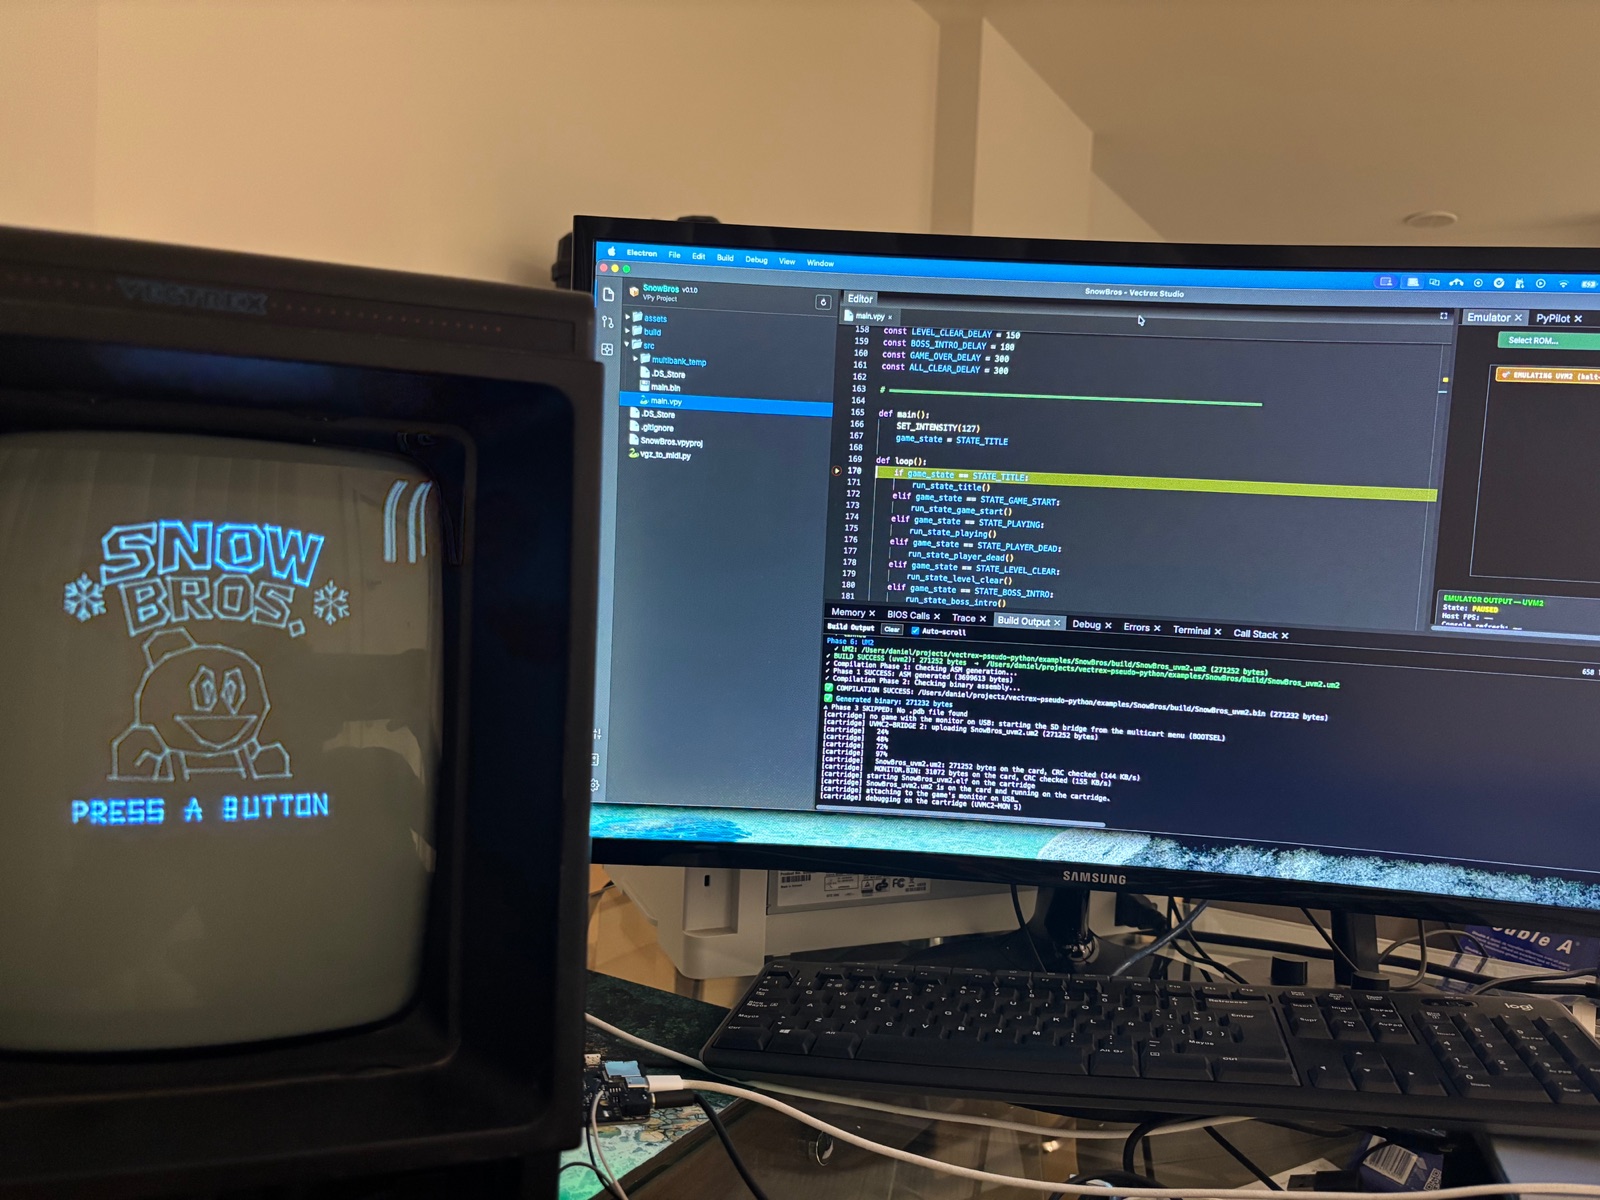
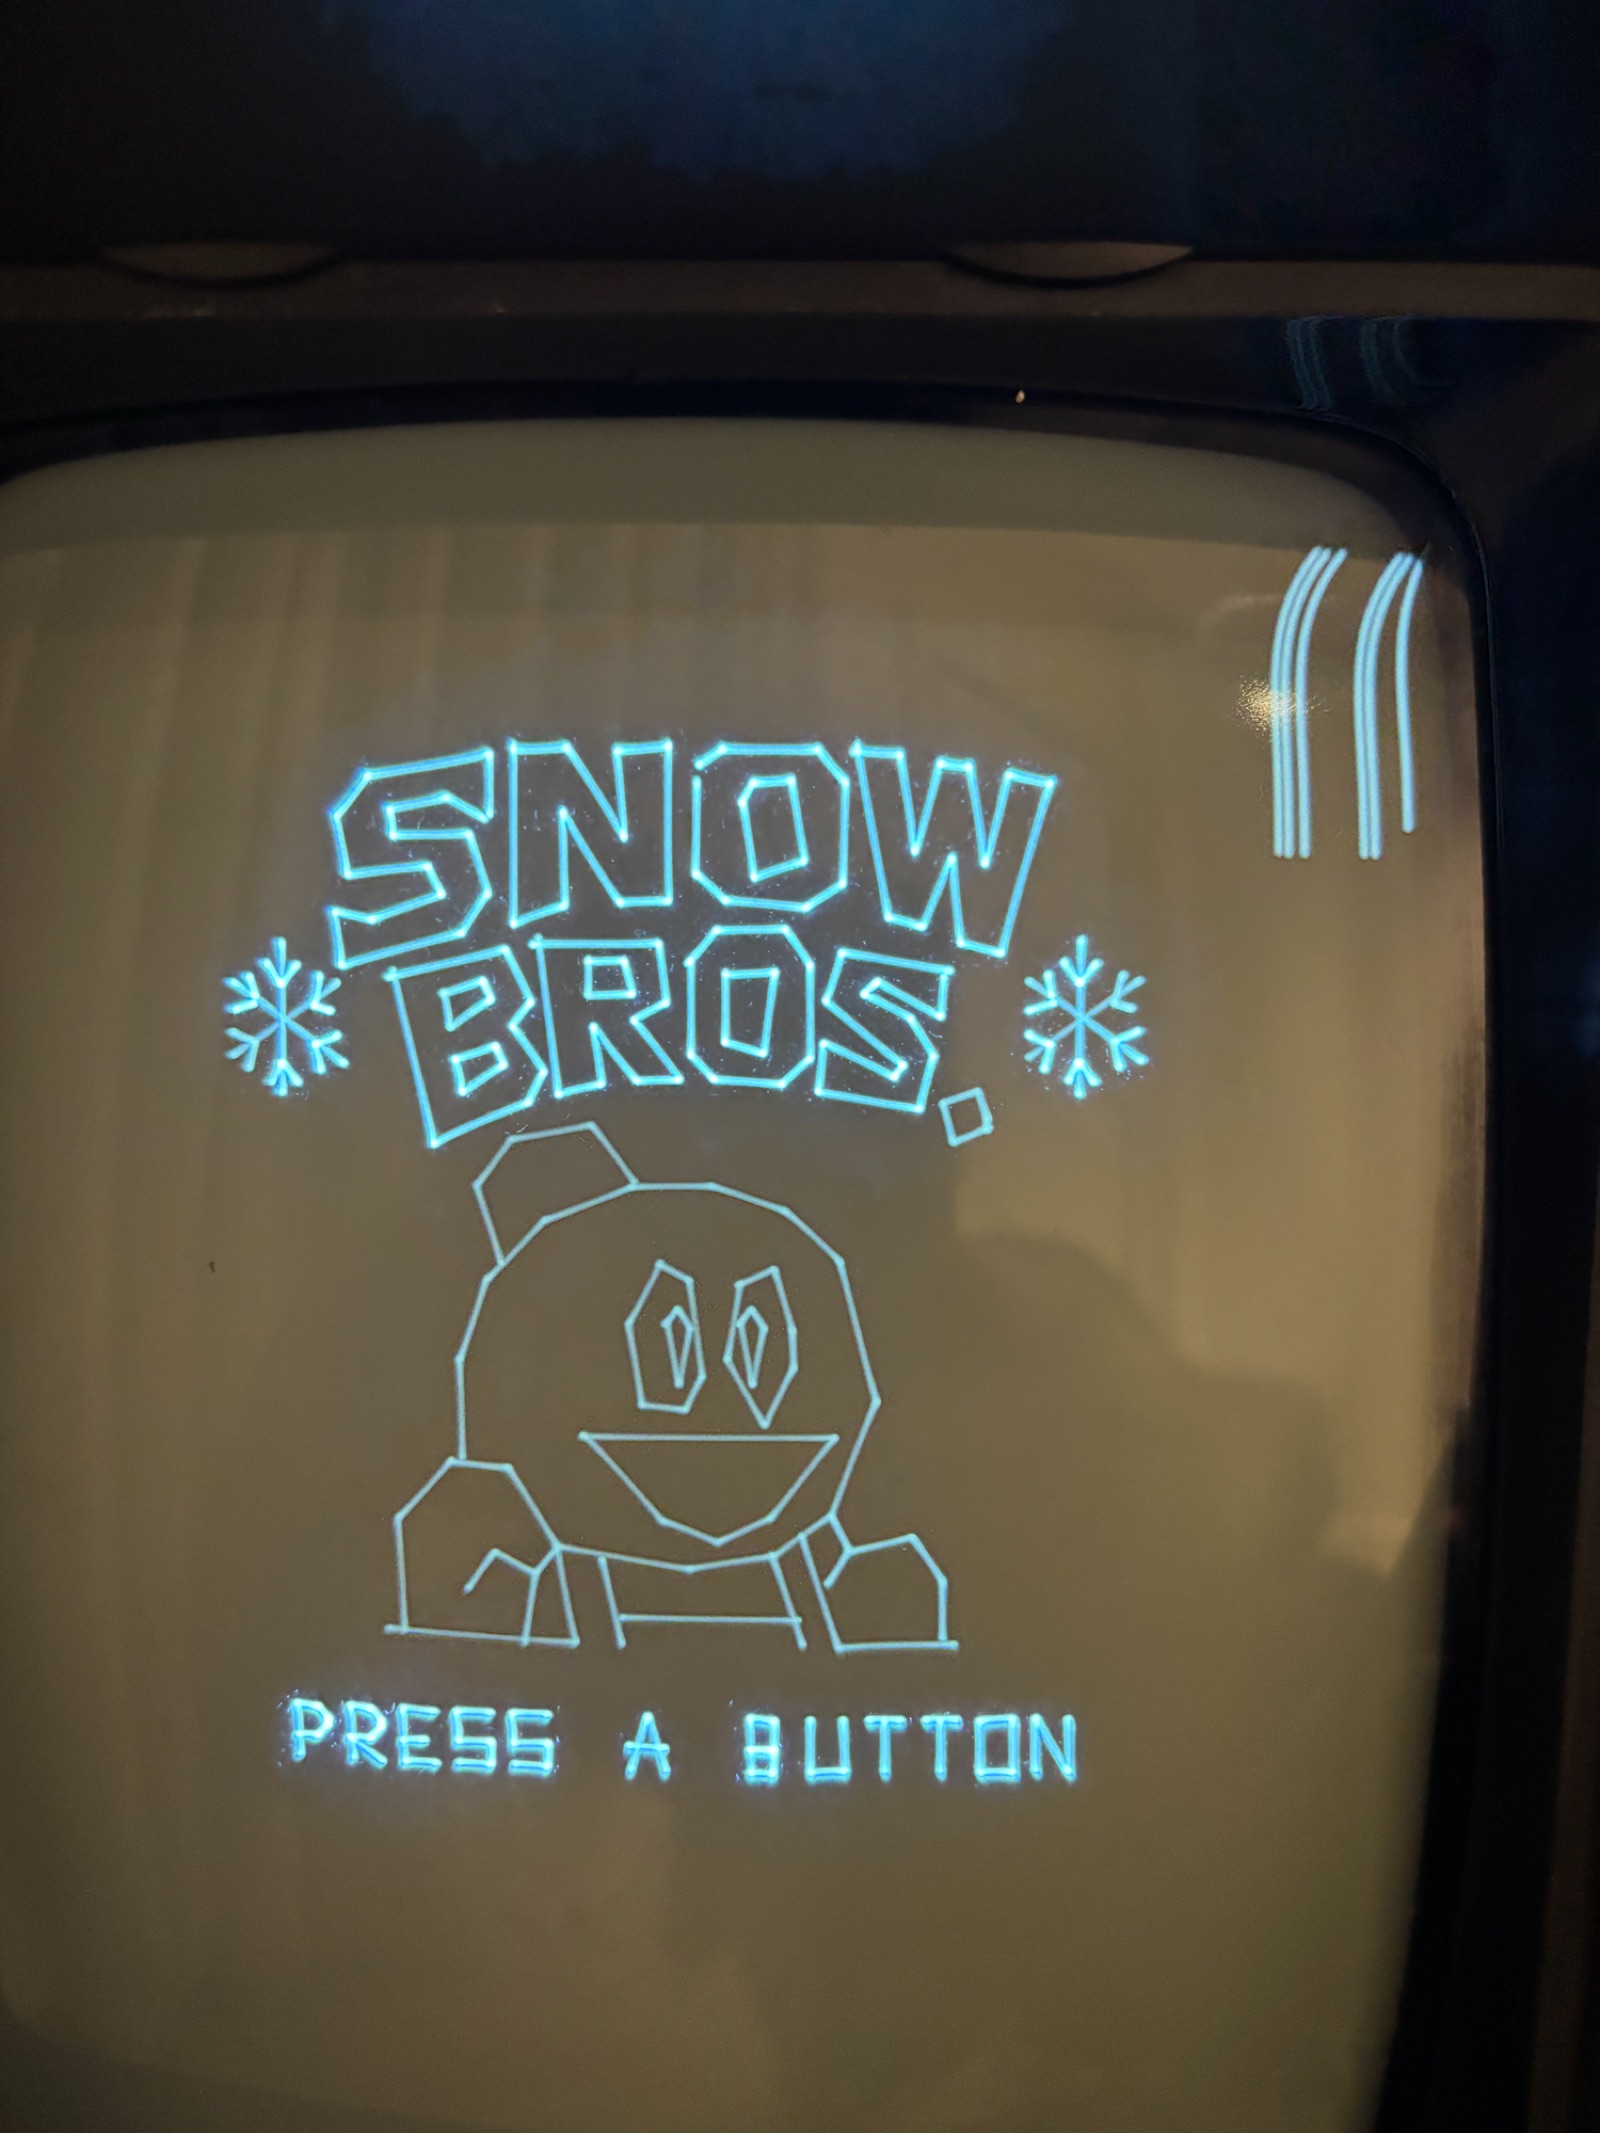
While the game is paused, the console keeps showing the last picture, with a pause sign in the top-right corner. Stop Debugging on Cartridge, or simply closing or reloading the IDE, takes every breakpoint out and leaves the game running.
How it works
The game is built with a debug monitor (and -Og). The monitor uses the Cortex-M33's monitor-mode debug: a breakpoint (a BKPT the monitor writes over the game's code, keeping the original), a step or a pause raises a debug exception, and the core waits there while the USB interrupt keeps answering the IDE. The chip is never frozen, and core 1 keeps redrawing the last picture. Steps run on the cartridge: the IDE marks where the step may stop, and the game runs to the first of them.
Limits
- From the first frame on. The monitor starts at the end of the game's first frame, so a line that only runs before it, early in
main()orsetup(), does not stop. - Core 0 only. Only the core running the game is debugged.
- VPy games need SDK v1.4.5 or later. Before it, a VPy game linked the monitor but never started it, so the cartridge never answered on USB. The IDE says so when you try.
gdb on the cartridge
The monitor also offers a second USB port that speaks gdb's remote protocol:
arm-none-eabi-gdb game.elf -ex "target remote <port>"The SDK's tools/uvmc2.py gdb prints the port, and the same script can deploy, upload, run and show the log from a terminal. Use the IDE's debugger or gdb, one at a time.
On the RP2350 Debug Cartridge, Over SWD
With the RP2350 target, the same Debug on Cartridge menu item debugs the game on the RP2350 debug cartridge the classic way, through its SWD header. Stop Debugging on Cartridge (or Stop) ends the session and leaves the game running.
You need:
- a Raspberry Pi Debug Probe, or any CMSIS-DAP probe, on the cartridge's SWD header;
- probe-rs (
cargo install probe-rs-tools); - the cartridge firmware with the SWD launch mailbox, flashed once.
What happens:
- The IDE builds the project as a RAM image for the SD card, with its ELF.
- It resets the cartridge to its menu, attaches probe-rs to the core that runs the game, and writes the image into the cartridge's PSRAM.
- It asks the menu to launch it, and the game starts exactly as it would from the SD card. The IDE also passes the game's card name, so games with romsets or samples on the SD card find them.
The other core keeps redrawing the last picture, so a paused game stays on screen. Breakpoints, steps, Continue/Pause, the call stack and hover work as in the emulator. A step takes about a second, because each stop reads the registers and the memory the editor shows through the probe.
- Change Value works on globals and on locals in memory. A local held in a register cannot be changed here: probe-rs cannot set a core register.
- Game text (RTT).
vpy_logandDEBUG_PRINT_LABELEDin a C game, andDEBUG_PRINTin a VPy program built as C, write to an RTT buffer. The IDE reads it every 200 ms and shows each line in the build output as[rtt] .... With no debugger reading, the text is dropped and the game runs the same. - Every breakpoint is removed when the session ends.
For the cartridge's own counters, HUD and SWD scripts, see Debugging on Hardware.
C Projects
C projects (.cvproj) use the same debugger on RP2350 and UVM2, in the emulator and on both cartridges.
-
Breakpoints work in your own C files.
-
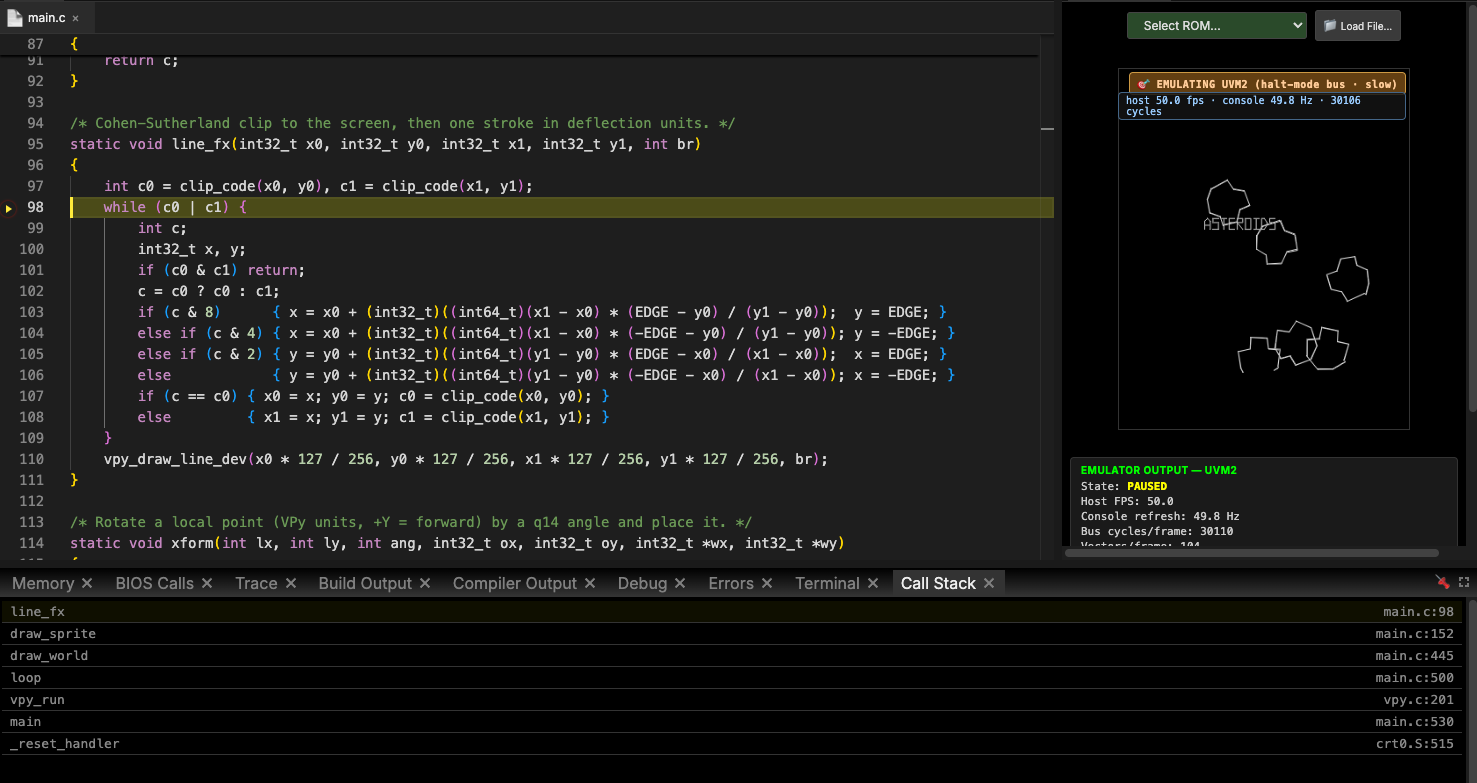
Step Into goes all the way down, into any code with line information: the SDK's C and libvpy, opening the SDK's file in the editor. Step Over and Step Out from your own files stop only in them; once inside the SDK, they go line by line there too.
-
Hover shows a value next to clangd's own hover:
- parameters and locals of the function the hovered line is in, when it is running or inlined where the program is paused;
- globals and file
staticvariables; s.field, andarr[i].field(the field of every element).
A member read through a pointer (
p->field) is not shown.
PiTrex and the WASM simulator have no debugger.
Panels
| Panel | What it shows |
|---|---|
| Call Stack | While paused: the innermost function first, each user function with its file and line (click to open), then its callers down to main. Opens by itself on the first stop of a session. |
| BIOS Calls | Which Vectrex BIOS routines the game calls, and how often. Useful for diagnosing drawing performance. |
| Memory | RAM contents, raw bytes or grid, with variable names from the .pdb. |
| Debug | DEBUG_PRINT output and watched variables, updated every 100 ms. |
| Trace | An instruction-level execution trace, when enabled. |
Every panel is in the View menu, in alphabetical order. For the emulator itself, see Emulator & Debugger.